Entity-Relationship (ER) Diagram
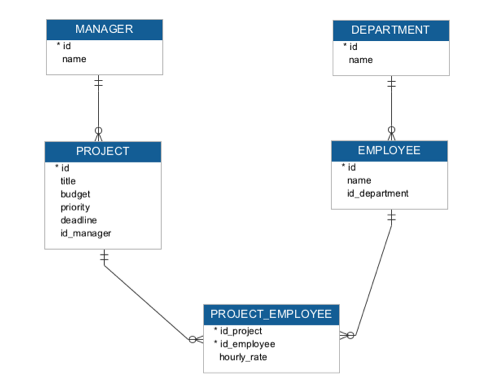
Figure below shows ER diagram of our database.

ER diagrams are the standard way of representing data models. The three main components of an ER diagram are:
- Entity - may be defined as a thing which is recognized as being capable of an independent existence and which can be uniquely identified. An entity is an abstraction from the complexities of a domain. Entities can be thought as nouns. In our case, entities are
Manager,Departmentand so on. - Relationship - may be defined as a way of capturing how entities are related to one another (interaction between entities). Relationships can be thought of as verbs, linking two or more nouns. In our case, we can see for example, relationship between
ManagerandProjectentities represented by line. - Cardinality - defines the relationship between the entities in terms of numbers. An entity may be optional: for example, a new manager could have no project assigned; or mandatory: for example, there must be exactly one manager for every project. ER diagram, in previous figure, use Crow's Foot notation. In this notation, a single bar indicate one, a double bar indicates one and only one, a circle indicate zero and a crow's foot indicates many. The three main cardinality relationships are: one-to-one, expressed as 1:1; one-to-many, expressed as 1:N; and many-to-many, expressed as M:N.
Please note, that in previous figure names of some attributes are changed, because there is no need to call, for example, number of manager Project Manager No when we see that attribute in context of Manager table (entity) - it is suffice to name it no or even better id.